Article Text

Abstract
Objective To evaluate the effectiveness of roadway policies for lighting and marking of farm equipment in reducing crashes in Illinois, Iowa, Kansas, Minnesota, Missouri, Nebraska, North Dakota, South Dakota and Wisconsin.
Methods In this ecological study, state policies on lighting and marking of farm equipment were scored for compliance with standards of the American Society of Agricultural and Biological Engineers (ASABE). Using generalized estimating equations negative binomial models, we estimated the relationships between lighting and marking scores, and farm equipment crash rates, per 100 000 farm operations.
Results A total of 7083 crashes involving farm equipment was reported from 2005 to 2010 in the Upper Midwest and Great Plains. As the state lighting and marking score increased by 5 units, crash rates reduced by 17% (rate ratio=0.83; 95% CI 0.78 to 0.88). Lighting-only (rate ratio=0.48; 95% CI 0.45 to 0.51) and marking-only policies (rate ratio=0.89; 95% CI 0.83 to 0.96) were each associated with reduced crash rates.
Conclusions Aligning lighting and marking policies with ASABE standards may effectively reduce crash rates involving farm equipment.
This is an Open Access article distributed in accordance with the Creative Commons Attribution Non Commercial (CC BY-NC 4.0) license, which permits others to distribute, remix, adapt, build upon this work non-commercially, and license their derivative works on different terms, provided the original work is properly cited and the use is non-commercial. See: http://creativecommons.org/licenses/by-nc/4.0/
Statistics from Altmetric.com
What this paper adds
Crashes involving farm equipment are an occupational injury risk for farmers as well as for all roadway users.
Legislative approaches to preventing farm equipment crashes, specifically those that require the lighting and marking of farm equipment driven on public roadways, have not been evaluated for their effectiveness.
In this study, state policies on lighting and marking of farm equipment were scored according to how strongly they aligned with standards offered by the American Society for Agricultural and Biological Engineers (ASABE), and states' rates of farm equipment crashes were then correlated with their levels of compliance to ASABE.
Lower rates of crashes involving farm equipment were found in states with stronger lighting and marking policies, suggesting the effectiveness of policies that increase visibility and conspicuity of farm equipment.
Introduction
Legislative approaches to disease and injury prevention are among the most significant public health advances of the 20th century,1 with some of the most influential policies in the field of roadway traffic injuries. Roadway safety legislation enacted since the 1950s has impacted the roadway environment, driver behaviour and vehicle properties, and has accounted for more than a 70% reduction in roadway traffic fatalities in the USA.2 However, because they are determined primarily at the state level, policies that address roadway safety vary markedly. Motorcycle helmet laws, speed control, graduated driver's licensure and impaired driving, to name a few, differ from state to state. Although many issues, such as public awareness and enforcement, affect compliance with and effectiveness of laws in general, stricter policies are associated with reduced crash rates.3–9
Among all road types, rural roads have the highest crash rates and crash injury rates per mile driven,10 ,11 due to a combination of road design, types of roadway vehicles and driver behaviour. Crashes involving farm equipment on the roadway explain some of this excess risk, although these crashes are not limited to rural roads.12 While farm equipment can be found on roads in all states, states with a higher proportion of farmland are likely to have higher roadway exposures to farm equipment and thus potentially more crashes. The upper Midwest and Great Plains states (Illinois (IL), Iowa (IA), Kansas (KS), Minnesota (MN), Missouri (MO), Nebraska (NE), North Dakota (ND), South Dakota (SD) and Wisconsin (WI)) comprise a region with strong agricultural sectors, and altogether, experience an average of over 1100 reported motor vehicle crashes involving farm equipment each year.
Farm equipment crashes are a concern for all roadway users. Roadway crashes with farm equipment are most often the fault of passenger vehicle operators, and occupants of passenger vehicles are more than five times as likely to be injured as the farm equipment operator.13 Such crashes are also likely to increase with urban sprawl, which is defined as the urban growth that encroaches on formerly rural, agricultural areas near population centres.14 ,15 Farm equipment crashes are further exacerbated by the consolidation of farming operations and the accompanying shift to larger agricultural equipment. Passenger vehicle operators are neither familiar with farm equipment nor well versed in how to interact with very large, slow moving vehicles on public roadways.16
Crashes are attributed to speed and size differentials between farm and passenger vehicles, and the inability of drivers to correctly gauge the speed of slower moving farm equipment. Improved conspicuity of farm equipment on public roadways is one policy approach aimed to reduce farm vehicle crashes and related injuries,13 and all states have policies that require some type of lighting and marking of farm equipment. However, research on standards for lighting and marking of farm equipment operated on public roadways is virtually non-existent, and no evaluations have examined the effectiveness of lighting and marking policies. Over 20 years ago, Eicher et al17 reviewed traffic codes for all 50 US states and found discrepancies in laws pertaining to lighting and marking of farm equipment on public roadways. Follow-up research to examine effects of the variety of laws on crash rates has not, to the best of our knowledge, been undertaken.
To evaluate the effectiveness of laws regulating lighting and marking of farm equipment operated on public roadways in the nine Great Plains states, we characterised policies in relation to standards defined by the American Society of Agricultural and Biological Engineers (ASABE), and assessed the relationship between the comprehensiveness of the laws and state farm vehicle crash rates. We hypothesised that increased compliance to ASABE standards is associated with lower rates of farm equipment crashes.
Methods
Study design and data sources
This ecological study compared state regulatory statutes and administrative codes to standards defined by the ASABE, and created comprehensive scores that allowed direct state comparisons. Crash report data for crashes that involved farm vehicles were provided by the nine state Departments of Transportation (DOT).
Policy scores
Originally, 29 potential policy components were identified from a previous study.17 An additional eight items on lighting and marking of stopped/parked equipment or of new equipment, age to operate, licensure requirements and passengers on farm equipment were added to a questionnaire used to query state codes and administrative rules. Of the 37 questionnaire items, 32 pertained to lighting or marking. This analysis focused on 21 items related to the lighting and marking of the farm equipment, which addressed the standards offered by the ASABE.18 ,19
ASABE guidelines were considered a ‘gold standard’ for comparison of policies across states. The 21 items were divided into separate scores for lighting and marking. Thirteen items pertained to lighting (eg, number of headlights and taillights, colour of taillights, turn signal requirements, and location of lights), 3 to both lighting and marking (eg, requirements for defining outer bounds of the farm implement) and 11 to marking (eg, reflectors, slow moving vehicle emblems). Composite scores were calculated for lighting, marking and the combination of lighting and marking. To create these scores, two points were assigned for each item in which the regulatory statutes and administrative codes met or exceeded the gold standard item; one point if the item was addressed but not up to gold standard criteria; and zero points if the item was not addressed. The lighting score included 13 items (range 0–26), the marking score included 11 items (range 0–22), and the combined lighting and marking score included 21 items (range 0–42). The combined lighting and marking score is not the sum of the other scores because the three items pertaining to both were counted only once for the overall score. For comparability, these three scores were standardised by rescaling to the range 0–100.
Regulatory statutes and administrative codes for the nine study states were searched on each state's online legislative database as well as through browsing LexisNexis Academic for common search terms such as ‘farm tractor’, ‘implements of husbandry’, ‘lamps’ and ‘slow moving vehicle’. Applicable statutes and rules were downloaded and saved in electronic format, including dates of implementation. Statutes and rules for each state were abstracted by project staff, and reviewed by a commercial vehicle enforcement officer or transportation regulations specialist from each of the nine states. Policies were collected and reviewed in 2012. Information in the LexisNexis Academic search included dates of enactment. No policy changes were identified during the study period (2005–2010), so scores were consistent year to year.
Farm equipment crash data
Each state's DOT was contacted to obtain data on police-reported crashes that involved farm equipment. Police-reported crashes most frequently involve crashes on public roadways that cause damage of sufficient severity to require police response. Crash data were collected from 2005 through 2010. Farm equipment was defined as tractors or any other self-propelled farm implement. Farm equipment was identified in the crash reports through a variable that described vehicle type.
Crash rates were calculated per 100 000 farm operations to control for roadway exposure to farm equipment, since data on farm vehicle miles travelled are not available. For the years 2005 through 2010, the number of farm operations was identified from the US Department of Agriculture's National Agricultural Statistical Service.20
Variables
The outcome used in this analysis was the count of all reported farm equipment crashes involving more than one vehicle. Single vehicle crashes were excluded as they would not likely be affected by increased lighting and marking on the farm equipment.
The main predictors were the state policy scores, including the lighting score, the marking score, and the combined lighting and marking score. Five state-level factors were considered as possible confounders associated with both the type of lighting and marking policies implemented by each state, and farm equipment crash rates: state population, ‘cultural tightness’ of each state, average farm size, average net cash farm income and the agricultural industries' economic contribution to each state's gross domestic product (GDP). The population of each state from 2005 to 2010 was obtained from US Census data. The ‘cultural tightness’ is a valid and reliable index developed to reflect a state's strength of punishment, degree of permissiveness of individual deviance, religiosity and per cent of the population that is foreign.21 Cultural tightness has been used in the policy evaluation literature as a confounder associated with the passage and implementation of safety laws.22 ,23 The proportion of each state's agriculture industry to its GDP (%) was gathered from the Field to Market 2012 Environmental and Socioeconomic Indicators Report.24 Average farm size and average net cash farm income from years 2007 and 2012 were both collected from the US Department of Agriculture's National Agricultural Statistical Service,20 and then extrapolated for years 2005–2006 and 2008–2010.20 The state average cash income to farmers may reflect an average farmer's financial ability to retrofit old or purchase new equipment.
Data analysis
To model the impact of the lighting, marking, and combined lighting and marking score on crash rates, generalised estimating equation (GEE) negative-binomial regression models were used with an offset of the natural log value of the number of farm operations. A set of univariate models with each state policy score as the sole covariate, and another set of multivariable models with each state policy score and three confounders as covariates were fitted. Since the crash counts were clustered by state over time, an exchangeable variance–covariance structure was imposed on outcomes from the same state over time.
To assess the influence of each state on the inferential results, Cook's distance and cluster leverage were examined, and states with high values identified. Consistently, in the univariate and multivariate models, IL and MO had higher values for cluster leverage than the remaining seven states. IL and MO had the highest two Cook's distance values in the multivariable model where the main predictor is the combined lighting and marking score, with values at least 54.1 greater than the average Cook's distance of the other states of 4.1. In the multivariable model with the marking score being the main predictor, the Cook's distance values of these two states were at least 14.8 higher than the average Cook's distance of the rest of the states of 1.5. In univariate models, IL had the largest Cook's distance as well. Rather than omit data from these two influential states, indicator variables for these two states were created and included in all models. These empirical results support the notion that unmeasured factors, such as political atmosphere, reporting practices and policy enforcement, are vastly different in MO and IL compared with the rest of the Midwestern states included in this study. In statistical modelling applications, indicators are occasionally employed to minimise the impact of highly influential cases that could conceivably be explained by the inclusion of unmeasured or omitted factors.25
The final model sets included crude models fitted with one state policy score and two indicator variables for the two influential states, and another set of adjusted models fitted with five additional state-level confounders (ie, population, cultural tightness, per cent of the state GDP from the agricultural industry, average farm size and average net cash farm income). Residuals from the fitted models were examined to verify that the model assumptions were met.
All data analyses were conducted in SAS V.9.30.
Results
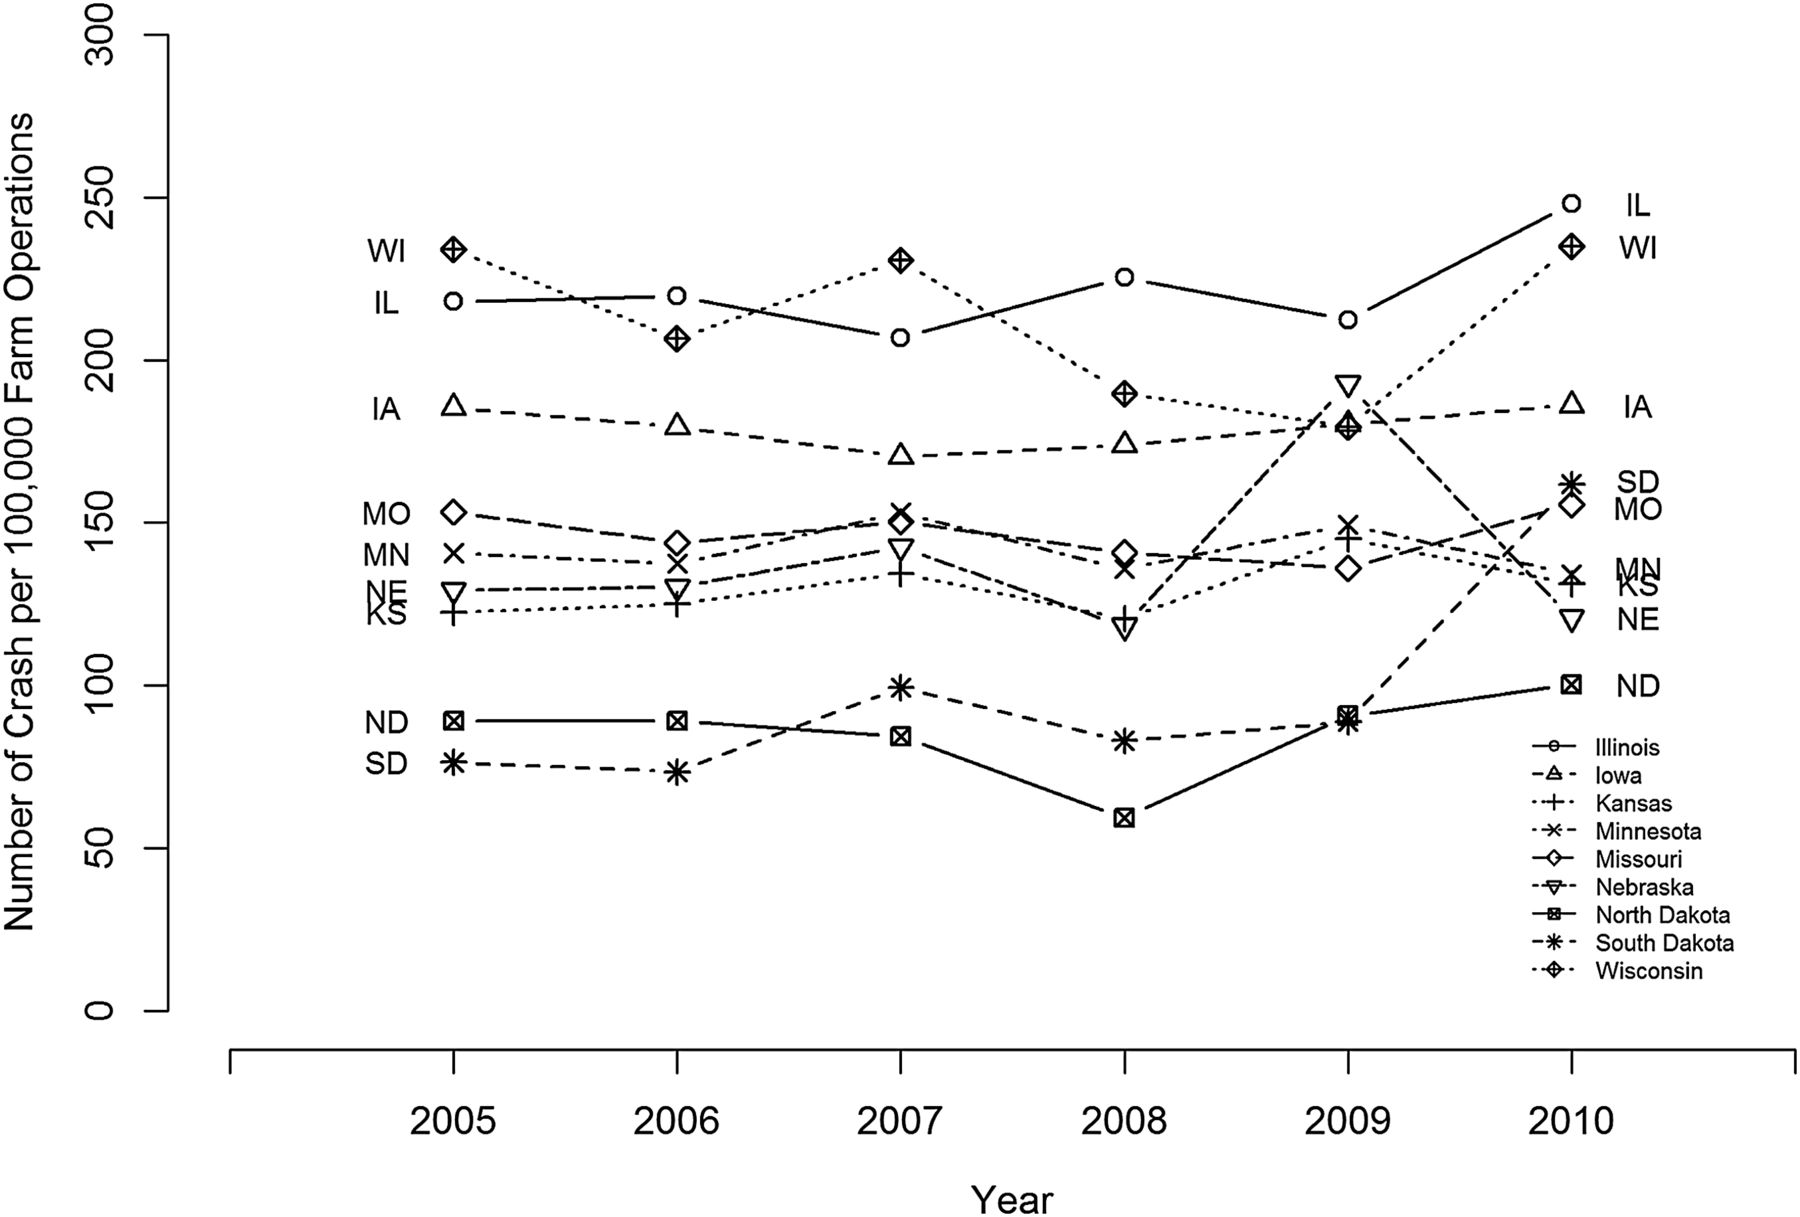
From 2005 to 2010, 7083 crashes involving farm equipment were reported in the nine study states. Average annual crash rates ranged from a low of 85.5 per 100 000 farm operations for ND to a high of 221.7 per 100 000 farm operations for IL. Rates and relative rankings remained relatively steady by year (figure 1), although NE had a spike in 2009.

Farm equipment crash rates for nine states, 2005–2010.
ASABE lighting and marking standards as well as state compliance to these standards are presented in table 1. Compliance scores ranged from a low of 12 in MO to a high of 69 in IL, while the remaining seven states (IA, KS, MN, NE, ND, SD and WI) ranged from 36 to 62. With the exception of SD, states were more compliant with lighting recommendations than with marking recommendations. IL (score=73), KA (score=62) and ND (score=58) were the most compliant to ASABE lighting standards. All nine states were compliant with ASABE standards for red taillights, but only one state (IL) required turn signals for new equipment manufactured since 2003. Compliance to marking standards was comparatively lower, although all states fully or partially required slow moving vehicle emblems. Only one state (IL) complied with ASABE's standard size of reflectors, but only for new equipment.
Compliance scores: farm equipment lighting and marking laws in nine Midwest states compared with ASABE standards
The GEE negative-binomial model estimates measure the impact that a five-unit increase in the policy score would have on the crash rate. Based on the crude models, the crash rate would be expected to decrease by 11%, 14% and 8%, with a five-unit increase in the combined lighting and marking score, lighting subscore and marking subscore, respectively, and this association was found to be statistically significant (respective p values=0.0263, 0.0146 and 0.0010; table 2). Stronger associations between policy scores and crash rates were found in the adjusted models. Specifically, a five-point increase in the combined lighting and marking score (rate ratio 0.83; 95% CI 0.78 to 0.88) in the lighting subscore (rate ratio 0.48; 95% CI 0.45 to 0.51) and in the marking subscore (rate ratio 0.89; 95% CI 0.83 to 0.96) were associated with 17%, 52% and 11% reduced crash rates, respectively.
Change in crash rates associated with five-unit increase in compliance score from the overall and refined model
To put these findings in perspective, we calculated the expected decrease in the number of farm equipment crashes for each state if it increased its combined lighting and marking score by 25 units, which represents approximately a 25% improvement in compliance in the entire sample (figure 2). For example, WI could expect an annual average decrease from 164 to 65 crashes.

Expected decrease in average annual number of farm equipment crashes as lighting and marking score improves 25 units. IA, Iowa; IL, Illinois; KS, Kansas; MN, Minnesota; MO, Missouri; NE, Nebraska; ND, North Dakota; SD, South Dakota; WI, Wisconsin.
Discussion
Lighting and marking of vehicles increases visibility and conspicuity on the roadway—a strategy believed to reduce crashes involving, especially, slow moving vehicles such as farm equipment on rural roads. Prior studies, not specific to farm equipment, support the notion that lighting reduces crashes. Farmer and Williams26 reported modest reductions in daytime crash rates with the use of automatic daytime running lights on passenger vehicles. Henderson et al27 reported that ‘rear and side lighting for vehicles and reflectorisation for all road users’ are effective at night.
The US DOT's National Highway Traffic Safety Administration (NHTSA) regulates lighting, signalling and reflective equipment on ‘passenger cars, multipurpose passenger vehicles, trucks, busses, trailers, (except pole trailers and trailer converter dollies) and motorcycles’ manufactured in the USA since 1 January 1969.28 However, no federal laws on lighting and marking of farm equipment exist in the USA,15 although standards are available from ASABE. Despite the presence of ASABE standards, state laws on lighting and marking lack uniformity, and vary considerably from state to state.17 Dennis et al29 and Glascock et al30 recommend stronger adherence to ASABE standards. Our study is the first to provide evidence that increased compliance to ASABE standards on lighting and marking of farm equipment is associated with reduced crash rates.
We also were able to examine the impact of two separate components of the law. Lighting policies had the most notable impact, as they were significantly associated with more than a 50% reduction in crash rates. Speed differentials between slow moving farm equipment and other motor vehicles occur on all roadways. Lighting farm equipment can especially reduce crashes by increasing the conspicuity of farm vehicles for motor vehicles approaching from behind.31 With farm vehicle visibility from behind increased by additional lighting, other motorists on the road will have more time and increased stopping distance to prevent crashes.
Marking policies were found to be moderately protective against crashes. States with greater compliance to ASABE marking standards had 11% lower farm equipment road crash rates than states with lower compliance. Slow moving vehicle emblems and reflectors—types of markings—are very low cost and require little maintenance. In fact, the IL State Patrol for many years provided packets including emblems and self-adhesive reflectors free of charge.
Our research contributes to a larger body of policy research that has impacted traffic safety for decades. Seat belts, for example, started as voluntary standards, which later, through research, influenced both the implementation of seat belt laws and the design of automobiles. Also, newer studies continue to support the evidence for traffic safety policies. A 2011 study used methodologies similar to this research and that of Eicher et al17 to establish ‘an open-source data set of laws restricting the use of mobile communication devices’.32 In another recent study, Xuan et al33 found that stronger policies on impaired driving and binge drinking were associated with reduced impaired driving. Studies such as these can widely influence traffic safety behaviours, manufacturers and culture. For example, ASABE lighting and marking standards adopted by equipment manufacturers have influenced the design and engineering of new farm equipment. As policies are improved on and amended, our research provides an evidence base for the standards offered by the ASABE.
While this research focused on the content and effectiveness of state laws, we did not know how these laws were implemented at the individual level. Our research did not measure awareness about, adherence to or enforcement of the lighting and marking laws in the states in this study. Of particular concern is the ubiquitous presence of older unlit and often unmarked farm equipment. Murphy et al34 report that the average age of the US tractor fleet is >25 years. Although all state laws provide minimum lighting and marking requirements irrespective of age, no state laws mandate the retrofitting of older equipment. Hence, lighting and marking of older equipment is left to the discretion of the farm operator, as opposed to newer equipment, which is now manufactured with lights and reflectors. Adherence to state laws would therefore be critical to measure at the individual level to completely understand the full effect of the laws. Nonetheless, as an ecological design, our study appropriately examined the content of state laws and state-level crash rates. This type of investigation provides a foundation for future research needed to address lighting and marking behaviours at the individual level.
Other limitations of this study include variations in the reporting of crashes, which are completed by law enforcement agencies that may differ in their coding or classification of farm equipment. Variability also exists in the type and amount of data collected and reported by the individual state DOT. Vehicle identification numbers were present in <30% of crash reports, so classification of farm equipment could not be verified. It is also possible that all lighting and marking statutes were not captured through our database review. However, by involving commercial vehicle enforcement officers and transportation regulations specialists in the review of policies, few if any additional statutes related to operating farm equipment on the road were identified. None of these additional statutes were related to the ASABE standards on lighting and marking.
With increased urbanisation, farmers must navigate the risks related to operating large, slow moving equipment on roadways that involve interaction with other motorists driving smaller and faster vehicles. Since crashes involving farm equipment could lead to severe injuries to the farm equipment operator and other motorists, efforts at prevention are essential. Through this research, we found evidence that legislative approaches for lighting and marking of farm equipment may be an effective strategy to prevent crashes.
References
Footnotes
Contributors MR designed the study, accessed the crash data, monitored collection of policies, wrote the statistical analysis plan, supervised the cleaning and analysis of data, and drafted and revised the paper. RB collected policies, conducted policy analysis, drafted the introduction and revised the paper. HW conducted the data analysis, drafted the methods and analysis sections, and revised the paper. KH evaluated the lighting and marking policies, drafted part of the methods and revised the paper. JEC supervised the statistical analysis and revised the paper. CP-A interpreted results and revised the paper.
Funding This research was supported by the Great Plains Center for Agricultural Safety and Health, funded by National Institute for Occupational Safety and Health, Centers for Disease Control and Prevention. Grant Number U50 OH007548-11.
Competing interests None declared.
Provenance and peer review Not commissioned; externally peer reviewed.