Article Text

Abstract
Objectives The nephrotoxicity of cadmium at low levels of exposure, measured by urinary cadmium, has recently been questioned since co-excretion of cadmium and proteins may have causes other than cadmium toxicity. The aim of this study was to explore the relation between kidney function and low or moderate cadmium levels, measured directly in kidney biopsies.
Methods We analysed cadmium in kidney biopsies (K-Cd), blood (B-Cd) and urine (U-Cd) from 109 living kidney donors in a cross-sectional study. We measured glomerular filtration rate (GFR), cystatin C in serum, albumin, β-2-microglobulin (B2M), retinol-binding protein (RBP), α-1-microglobulin (A1M), N-acetyl-β-d-glucosaminidase and kidney injury molecule 1 (KIM-1) in 24 h and overnight urine.
Results We found significant positive associations between A1M excretion and K-Cd in multiple regression models including age, sex, weight, smoking and urinary flow rate. This association was also present in never-smokers. A1M was also positively associated with B-Cd and U-Cd. GFR and the other biomarkers of kidney function were not associated with K-Cd. GFR estimated from serum cystatin C showed a very poor correlation with measured GFR. KIM-1, RBP and possibly albumin were positively associated with U-Cd, but only in overnight urine. No associations were found with B2M.
Conclusions Our results suggest that A1M in urine is a sensitive biomarker for effects of low-level cadmium exposure. A few associations between other renal biomarkers and U-Cd, but not K-Cd, were probably caused by physiological co-excretion or chance.
This is an Open Access article distributed in accordance with the Creative Commons Attribution Non Commercial (CC BY-NC 4.0) license, which permits others to distribute, remix, adapt, build upon this work non-commercially, and license their derivative works on different terms, provided the original work is properly cited and the use is non-commercial. See: http://creativecommons.org/licenses/by-nc/4.0/
Statistics from Altmetric.com
What this paper adds
-
The concept that proteinuria is the critical effect in cadmium exposure has recently been questioned since associations between urinary cadmium and proteins may be due to physiological factors rather than cadmium toxicity.
-
The use of kidney cadmium instead of urinary cadmium, as in the present study, avoids such problems.
-
In spite of low-level cadmium exposure, the present study found a significant association between kidney cadmium and excretion of a low molecular weight protein in 109 healthy kidney donors.
-
This indicates that an effect on renal tubules may still be an early effect of cadmium exposure.
Introduction
The toxic heavy metal cadmium (Cd) is present in the environment as a pollutant from industrial and agricultural activities, but also occurs naturally.1–3 It accumulates mainly in the proximal tubules of the kidney and is known to cause renal dysfunction after chronic exposure in the workplace or when present in the environment.1–6 Different biomarkers of renal effects have been used in studies of cadmium toxicity.5 The toxic effects of cadmium on the proximal tubular cells cause decreased reabsorption of low molecular weight (LMW) proteins, which results in increased urinary excretion of these proteins, so-called ‘tubular proteinuria’.5 ,6
Some commonly used biomarkers linked to cadmium nephrotoxicity are the LMW proteins β-2-microglobulin (B2M), retinol-binding protein (RBP) and α-1-microglobulin (A1M, protein HC).5 ,7 Urinary B2M and RBP are sensitive markers of tubular dysfunction, and increased excretion of these LMW proteins is considered the critical renal effect of Cd.1–2 ,5 Urinary B2M has been the most commonly used test, but RBP has the advantage of being more stable in acid urine.5 A1M, a 26-kDa protein, is also very stable in urine, but it might be less specific as it can be elevated in tubular and in glomerular disease as well.8 A1M is a radical-binding lipocalin and a reductase, and is produced mainly in the liver but also in peripheral organs.9
The key measure of glomerular function is the glomerular filtration rate (GFR), which has seldom been measured in studies of cadmium exposure. GFR is considered the best index of renal function in healthy individuals and in those with kidney disease.10 The gold standard method is measuring GFR (mGFR) using urinary or plasma clearance of exogenous filtration markers such as inulin or iohexol. GFR can also be estimated (eGFR) from endogenous filtration markers such as serum creatinine or serum cystatin C.10 However, in some cases there can be large differences between eGFR and mGFR, since factors other than renal function can affect the endogenous determinant, for example, muscle mass.10–13
The LMW protein cystatin C, a cysteine protease inhibitor, is normally freely filtered in the glomeruli and then completely reabsorbed in the tubuli and metabolised. Serum cystatin C is a biomarker of renal glomerular function, with high sensitivity in mild and moderate renal disease.14 ,15 N-acetyl-β-d-glucosaminidase (NAG) is a lysosomal enzyme which primarily occurs in the proximal renal tubules, and increased urinary excretion may reflect proximal tubular injury. However, elevated urinary NAG can also be the result of elevated lysosomal activity and glomerular disease.14 ,15 A new biomarker of kidney damage is the kidney injury molecule 1 (KIM-1), a transmembrane protein in the renal tubules, which is elevated in urine in renal diseases, especially tubulointerstitial injury.14 The function of KIM-1 in the normal kidney is still not clear. Albumin in urine (U-Alb) is a well-established marker of several kinds of kidney disease, and is used in screening for early renal damage in diabetes and hypertension.14 Elevated excretion of albumin can be the result of glomerular and/or tubulointerstitial renal damage. In most studies, Cd levels in urine or blood have been used to indicate the kidney burden of Cd, as kidney Cd levels are more difficult to assess.5 However, using blood Cd increases the risk of overestimating the toxicity of Cd if the exposure has been reduced or stopped. In addition, when using U-Cd as exposure indicator, there is a risk of finding associations between Cd and LMW proteins in urine, which are not caused by Cd toxicity, but more likely by normal physiology such as changes in urinary flow.5 ,16 ,17 The purpose of this study was to explore the relation between low or moderate kidney cadmium concentrations and effects on kidney function. We used biopsies from living kidney donors in order to obtain kidney cadmium data from the healthy general population.18
Materials and methods
Kidney donors
A total of 167 eligible (adult and able to participate) living kidney donors were invited to the study at the Department of Transplantation and Liver Surgery at Sahlgrenska University Hospital in Gothenburg, Sweden. Data were collected between January 1999 and June 2002, and between April 2004 and February 2005. The median age was 50 years (range 24–70) among the 152 donors (81%) who agreed to participate in the study (87 women and 65 men). All 152 donors gave informed consent to their participation, and the study was approved by the Ethics Committee at the University of Gothenburg.
Less than 1 year before transplantation, all donors were examined with routine blood and urine tests, radiology and kidney function tests. Further routine examinations along with tests according to a study protocol were performed at the hospital 1 or 2 days before the transplantation. The morning after admission to the hospital, a timed overnight (ON) urine sample was taken. Most of the donors also provided a separate timed 24 h urine sample. In addition, the donors underwent a physical examination and an interview, and answered a questionnaire on smoking habits and occupational exposure, as previously described.18
During transplantation, a wedge biopsy was taken from the lower pole of the kidney after revascularisation in 126 of the 152 donors (83%), as part of the routine at the hospital. The purpose of this biopsy is normally to determine the state of the donated kidney and to have a reference if subsequent biopsies are needed. A part of the kidney biopsy was taken for metal analyses, but in 17 cases it was of inadequate size or quality. In 109 of the 126 cases (87%, 60 women and 49 men), the kidney biopsy could be analysed for heavy metal content.
Assessment of kidney function
GFR was measured in mL/min/1.73 m2 body surface area, in most cases as Cr-EDTA clearance or iohexol clearance. As other studies did not measure GFR, but used eGFR in their assessment of renal function,19–22 we also calculated eGFR using the cystatin C-based CKD-EPI formula: eGFR=127.7×serum cystatin C−1.17×age−0.13×0.91 (if female).23
A total of 106 timed morning urine samples and 95 24 h urine samples were collected from the 109 donors with available kidney metal concentrations. Sampling times were registered and urine volumes were measured. The urine was analysed for creatinine (U-Crea) using the Jaffé method (Roche Diagnostics) before June 2004 and thereafter with an enzymatic method (photometry, Modular P, Roche and CREAplus R1, R2, Roche Diagnostics, Mannheim, Germany). U-Alb was determined by an automated nephelometric immunochemical method with reagents and calibrators from Beckman Coulter (Fullerton, California, USA) with level of detection (LOD) of 2.0, 2.3 or 2.4 mg/L (14% of samples <LOD). B2M in urine (U-B2M) was analysed by a particle-enhanced immunoturbidimetric method (Modular P800, Hitachi Roche AB) with reagents from Roche/Hitachi (LOD: 0.2 mg/L, 31% of samples <LOD). As B2M is unstable in acidic urine,5 pH was corrected with diluted sodium hydroxide to the desired value (pH 6–8). A1M (U-A1M, protein HC) was determined using a nephelometric immunochemical method (IMMAGE Immunochemistry system, Beckman Coulter) with reagents from Beckman Coulter (LOD: 4.0 mg/L, 8% of samples <LOD). The activity of NAG (U-NAG) was determined using photometry (Cobas Mira S, Roche) with reagents from Roche Diagnostics (Mannheim, Germany; no samples <LOD (0.3 U/L)). A solid phase ELISA (the Quantikine Human TIM-1/KIM-1 Immunoassay, R&D Systems, Abingdon, UK) was used to measure KIM-1 in urine (LOD: 0.156 ng/mL, 2% of samples <LOD). Urinary RBP was determined using the RBP/RBP4 ELISA Kit from Immundiagnostik AG, Bensheim, Germany (LOD: 0.9 µg/L, no samples <LOD). Serum cystatin C was analysed by a particle-enhanced immunoturbidimetric method (Modular P800, Hitachi Roche AB) with reagents from Dako Cytomation AB (no samples <LOD (0.41 mg/L)).
The biomarkers of renal effects were adjusted for urinary creatinine to account for differences in concentration of the urine and the excretion rate per hour was calculated. For values below the limit of detection, LOD/√2 was used in the statistical analyses.24
Out of 109 participants with available results for cadmium in kidney and blood, ON urine samples and 24 h samples could be collected in 106 and 95 participants, respectively. The results for 24 h urine samples with volumes <700 mL (n=3) and >5000 mL (n=1) were considered false or unrepresentative and were excluded from the statistical analyses. Three additional 24 h urine samples were excluded due to missing values for urine volume and therefore 24 h U-Cd results are based on 88 participants. Owing to logistic shortcomings, some biomarker analyses failed; see table 1 for final numbers.
Means (ranges) of K-Cd, B-Cd, U-Cd, background factors and kidney function markers for all 109 kidney donors, and for men and women separately
All standard serum and urine analyses were performed by an ISO accredited laboratory at the Department of Clinical Chemistry, Sahlgrenska University Hospital, Gothenburg, Sweden. U-KIM-1 and U-RBP were analysed at the Department of Occupational and Environmental Medicine, University of Gothenburg, Sweden.
Cadmium in kidney, blood and urine
Cadmium concentrations in the kidney cortex biopsies, blood and urine were measured by inductively coupled plasma-mass spectrometry (ICP-MS; Thermo X7, Thermo Elemental, Winsford, UK) at the Department of Occupational and Environmental Medicine, Lund University, Sweden, as detailed elsewhere.18 ,25 The kidney samples were analysed in four different rounds and LODs were calculated as three times the SD for the blank (LOD: 0.05, 0.03, 0.03 and 0.03 µg/g; no values for kidney Cd were <LOD). Dry weight concentrations were converted into wet weight concentrations by multiplying by 0.18.18 For urinary Cd <LOD (0.03 or 0.05 µg/L), LOD/√2 was used in the statistical analyses, but for B-Cd we used LOD/2 (LOD: 0.01–0.04 µg/L).24
Statistical analyses
Associations between single variables were assessed by Spearman correlation coefficients (rs). Differences between groups were compared using Student t test for independent groups and a paired t test for related samples. Associations between biomarkers of kidney function, Cd in kidney, blood and urine, and background variables were assessed using multiple linear regressions. Owing to skewed distributions of several biomarkers, the natural logarithm of urinary biomarkers of kidney function was used in the multiple regression analyses. The variables included in the models are shown in equation 1. 1y=biomarker of kidney function; x=K-Cd, B-Cd or U-Cd
Weight was missing for two participants, and these were therefore not included in the multivariable analyses. Analyses according to equation 1 were also performed with kidney cadmium as a categorical variable after dividing the donors into two groups with high or low kidney cadmium (K-Cd > or ≤ the median of 12.9 µg/g wet weight). Three models with U-Cd were used: model 1 was equation 1 but without urinary flow rate, model 2 additionally included urinary creatinine and model 3 included urinary flow rate, but not creatinine. Statistical calculations were performed using SAS (V.9.2).
Results
Of the 109 donors with kidney Cd concentrations measured in biopsy material, 49 were men, 60 were women, 41 were never-smokers (19 men, 22 women; 38%) and 68 were ever-smokers (30 men, 38 women; 62%). The proportion of never-smokers was similar in men and women (39% and 37%, respectively).
We found relatively low kidney cortex cadmium levels (mean K-Cd 15.0, median 12.9 µg/g wet weight), significantly higher in women (mean K-Cd 17.1, median 14.7 µg/g wet weight) than in men (mean K-Cd 12.5, median 10.9 µg/g wet weight; p=0.01; table 1), as described previously.18
Results for background factors and kidney function markers are shown in table 1, stratified by sex. For GFR, albumin and A1M, online supplementary table S1 shows results stratified also by age, obesity, smoking and tertiles of cadmium in kidney, blood and urine.
Correlations between K-Cd and renal biomarkers
For correlations between markers of kidney function, Cd biomarkers and background factors, see online supplementary tables S2–S5. We found significant positive correlations between K-Cd and U-A1M normalised for creatinine (U-A1MCrea) in the 24 h sample (rs=0.27, p=0.02) and also in the timed ON sample (rs=0.36, p=0.0006; see online supplementary table S2). In addition, we found significant positive correlations between K-Cd and U-NAG as well as U-KIM normalised for creatinine in the 24 h sample (rs=0.34, p=0.01 for U-NAGCrea; rs=0.26, p=0.01 for U-KIMCrea).
There was also a significant positive correlation between K-Cd and ON U-RBP normalised for creatinine (U-RBPCrea, rs=0.24, p=0.01). There were no significant correlations between K-Cd and GFR, S-cystatin C, U-Alb, U-B2M, ON U-NAG, ON U-KIM or 24 h RBP. However, there were significant negative correlations between eGFR and all four measures of U-Cd (see online supplementary table S2), while the correlation between eGFR and mGFR was very poor (rs=0.16, p=0.12).
When the donors were divided into two groups with high or low kidney cadmium (K-Cd > or ≤ median), donors with high K-Cd excreted significantly more U-A1MCrea than those with low K-Cd, both in the 24 h sample (mean 8.5 vs 6.9 mg/g creatinine, p=0.03) and in the ON sample (6.1 vs 4.0 mg/g creatinine, p=0.0001). In the ON sample, donors with high K-Cd also excreted significantly more U-A1M/h (p=0.004).
Associations between K-Cd and renal biomarkers (multivariate analyses)
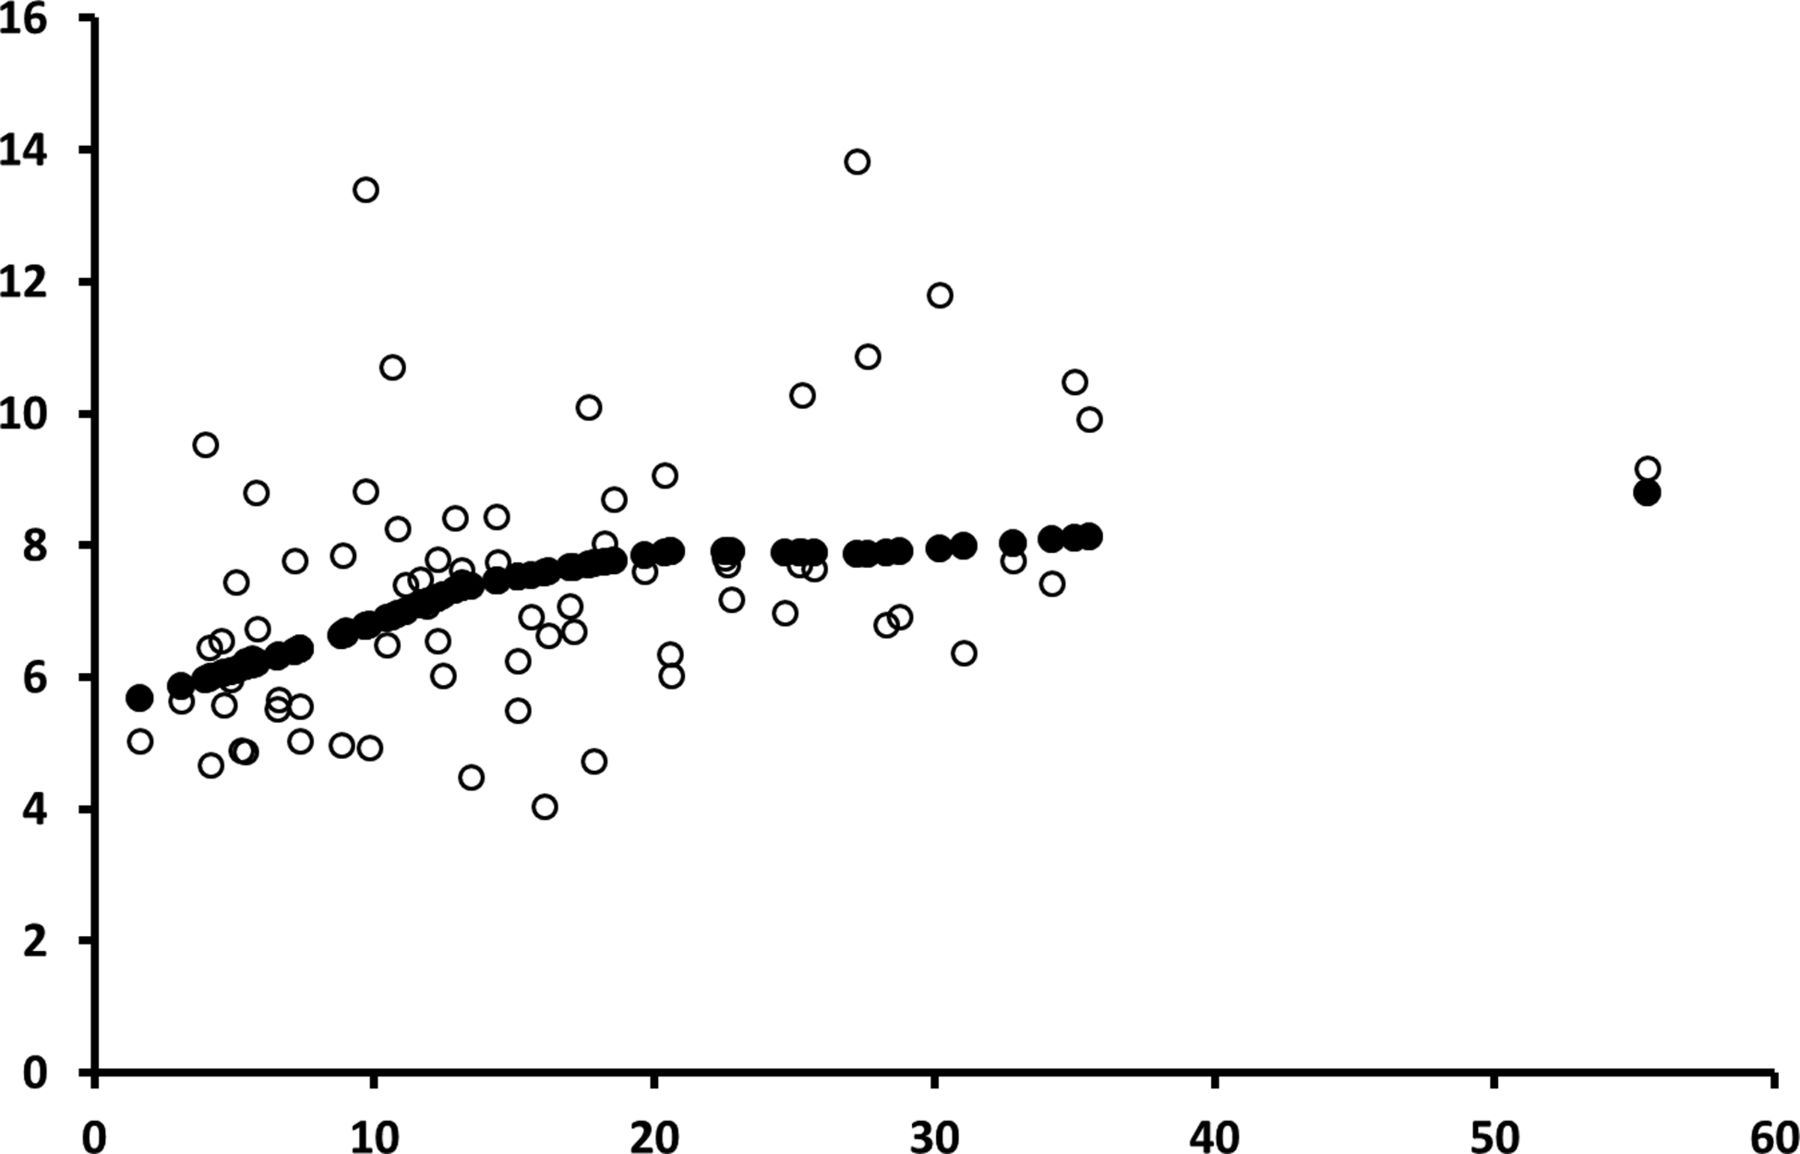
As shown in online supplementary tables S3–S5, in several cases biomarkers of kidney function were also associated with age, sex, weight, smoking and urinary flow rate. In the multiple regression model (equation 1) including K-Cd, age, sex, weight, smoking (never/ever), pack-years and urinary flow rate, lnU-A1M in ON samples was significantly and positively associated with K-Cd (table 2). The effect size estimated from the regressions corresponded to a 20% increase of U-A1M excretion per 26 µg/g kidney cadmium (90th centile minus 10th centile of K-Cd). An example of the association between K-Cd and lnU-A1M adjusted for creatinine is shown in figure 1. An association was also seen between lnU-A1M and K-Cd as a categorical variable (high/low) in ON urine normalised for creatinine (p=0.01) and expressed per hour (p=0.02).
Associations between ln-transformed biomarkers of exposure to cadmium and selected markers of kidney function in multiple regression models including age, sex, weight, smoking (never/ever) and pack-years
Scatter plot of α-1-microglobuline in 24 h urine (mg/g creatinine) by kidney cadmium (µg/g wet weight). Unfilled circles show the predicted excretion of α-1-microglobulin versus kidney cadmium according to a model with the following variables as linear effects: sex, age, weight, smoking, urinary flow and kidney cadmium. Filled circles represent the smoothed multiadjusted association between α-1-microglobulin and kidney cadmium (loess, 4 df) for an average individual.
The multivariate analysis was repeated for men and women separately, with the same model (equation 1). In men, there was again a significant positive association between lnU-A1M and K-Cd, in ON and 24 h urine, per hour and creatinine-adjusted. In women, there were no such significant associations.
No associations were found between GFR or the other biomarkers of kidney function and K-Cd, using the same regression model.
Associations between B-Cd and renal biomarkers (multivariate analyses)
In identical multiple linear regression models including B-Cd instead of K-Cd, ON lnU-A1M/h was associated with B-Cd (table 2). The effect size estimated from the regressions corresponded to a 24% increase of U-A1M excretion per 1.07 µg/L of blood cadmium (90th centile minus 10th centile of B-Cd). No associations were found between B-Cd and the other biomarkers of kidney function except for ON U-RBP (table 2).
Associations between U-Cd and renal biomarkers (multivariate analyses)
There were significant positive associations between urinary A1M and urinary cadmium. The association was present in the 24 h sample and in the ON sample, and it was statistically significant for U-Cd expressed as excretion rate (µg/h) or as concentration in a model that also included urinary flow rate (model 3; table 2). The association persisted when A1M was adjusted for creatinine (lnU-A1MCrea, data not shown).
There were some associations between U-Cd and U-Alb, U-KIM and U-RBP, but these were only found in ON urine (table 2). The negative associations between U-Cd and eGFR shown in online supplementary table S1 were no longer significant in the multivariate analyses.
Associations with smoking
Since smoking increases Cd exposure, and may also increase excretion of proteins, it is important to take smoking habits into account. However, the excretion rate of A1M was no higher among ever-smokers than among never-smokers (see online supplementary table S1), and there was no correlation between pack-years and A1M excretion (see online supplementary table S3). In the multivariable models shown in table 2, the β coefficients for smoking (categorical) and pack-years were negative, and p values were >0.05 for models with A1M excretion rate per hour in 24 h urine and ON urine as the dependent variable.
When the multivariable models were run in never-smokers only, the group sizes were small (n=26–31), but β coefficients for kidney Cd were larger than in all participants combined, and kidney Cd was a significant predictor for A1M excretion rate in 24 h urine (p=0.007) and ON urine (p=0.04). Also in models with B-Cd or U-Cd as exposure variables, the β coefficients were larger (p values 0.08–0.10).
Discussion
Cadmium is a nephrotoxic metal that accumulates in the proximal tubules of the kidney and causes increased urinary excretion of LMW proteins due to impaired tubular reabsorption. Several studies in the past 10–15 years have shown effects even at low levels of exposure, using cadmium in urine (U-Cd) as a biomarker of kidney Cd.4 However, this has recently been questioned, since co-excretion of cadmium and proteins may have causes other than Cd toxicity.7 ,16–17
The objective of this study was to explore whether the low or moderate levels of cadmium exposure that can be found in the general population may affect kidney function. As cadmium accumulates in the kidney, we used kidney biopsies from living kidney donors in order to obtain cadmium exposure data from the healthy general population. In the multiple regression analyses, we found a significant positive association between the excretion of the LMW protein A1M in urine (U-A1M) and kidney cortex Cd levels. Possible confounders or effect modifiers were included in the multiple regression models: age, sex, weight, smoking (never/ever and pack-years) and urinary flow rate. Since Cd was measured in kidney biopsies and not only in urine, we did not have to consider the potential problem of co-excretion due to physiological factors.16–17 We therefore believe that this association might reflect a causal association between low-level kidney cadmium and increased excretion of A1M in urine. The association seemed approximately linear without any obvious threshold. The same association was seen in never-smokers, which is important, since smoking may be a confounder regarding cadmium and proteinuria.11 In addition, positive associations were seen between lnU-A1M and Cd in blood, which also supports an association between Cd exposure and increased excretion of U-A1M. The magnitude of effect was of the same order for K-Cd and B-Cd.
It is not clear why there was a significant association between kidney cadmium and urinary A1M in men but not in women. One explanation could be that men might be more susceptible to kidney damage than women. It is well known that men have a higher prevalence and incidence of both diabetic and non-diabetic renal disease.26 It has also long been assumed that the rate of progression in renal disease is higher in adult men than in premenopausal women, possibly due to differences in sex hormones.26 However, a recently published meta-analysis found no difference between men and women in the risk of progression to end-stage renal disease at a given eGFR and urinary albumin-creatinine ratio.27
Cadmium in the bloodstream is to a large extent bound to proteins such as metallothionein, which are filtered in the glomeruli and reabsorbed in the tubuli in the same way as other LMW proteins.5 Thus, a decreased tubular reabsorption that is not due to cadmium could cause increased excretion of biomarkers of exposure (urinary Cd) and also outcome (LMW proteins in urine).5 ,16–17 The associations between ln-U-Alb, lnU-KIM-1, ln-U-RBP and U-Cd were probably due to co-excretion of cadmium with proteins,16 ,28 as no associations were seen with kidney Cd. The association between U-Cd and ln-U-NAG may have occurred by chance, since many associations were tested.
Owing to the aforementioned risk of artefacts when using U-Cd as measure of Cd exposure, we consider Cd levels in blood or the kidney to be more reliable as indicators of long-term cadmium exposure and body burden. If U-Cd is to be used we consider the excretion rate to be a more valid measure than the concentration in an untimed sample, adjusted for dilution. In the present study we could compare the excretion per hour for cadmium and proteins with results based on Cd concentrations, adjusted for dilution. Such adjustment is usually performed by calculating the Cd/creatinine ratio and the protein/creatinine ratio. This adjustment method assumes that the creatinine excretion rate is stable, and unaffected by the urinary flow rate, which, unfortunately, is not the case.29 Another technique of adjusting for dilution using creatinine is to include the creatinine concentration in the model as a predictor. In models based on U-Cd we compared this method (model 2) with a model that instead included urinary flow rate together with U-Cd (model 3). For U-A1M, U-KIM and U-RBP the models with urinary flow rate showed somewhat stronger associations with U-Cd and considerably higher R2 values. In models based on excretion rates, the urinary flow rate is not needed as an adjustment for dilution. Nevertheless, in our multivariable models based on excretion rates, urinary flow rate was usually a significant predictor of A1M, KIM and RBP excretion, especially in ON samples. Our group has previously shown that there is an effect of urinary flow rate on the excretion rates of Cd, A1M and Alb.16 In summary, if only untimed urinary spot samples are available, caution is warranted in interpreting associations between cadmium and proteins as due to toxicity, and such caution is recommended even if timed samples and volumes (and thereby urinary flow rates) are available. An important question that remains unanswered is why only one of the markers of kidney function, namely urinary A1M, was associated with cadmium levels in the kidney cortex. Although U-A1M has so far been considered to be a biomarker for tubular damage, it is possible that increased urinary A1M levels have an explanation other than renal damage. Knowledge about the function and metabolism of this glycoprotein is still far from complete. For example, an experimental study recently indicated that A1M is imported into the cells for protection of mitochondrial structure and function during cell death, and possibly also to prevent oxidative damage to surrounding tissue.9 One could speculate that cadmium-induced tissue damage might cause increased production of A1M, leading to increased leakage into urine. If this is the case, urinary A1M would not reflect decreased tubular reabsorption alone.
We found no associations between measured GFR and cadmium biomarkers, while such associations were present when GFR was estimated using serum cystatin C. Estimates of GFR from creatinine or cystatin C in blood have been shown to be imprecise and biased when GFR is normal or near normal.11–13 The bias is clearly shown in table 1, where eGFR is about 10% higher than mGFR. The imprecision is illustrated by the unrealistic ranges of eGFR (table 1). Reports on associations between U-Cd and eGFR should therefore be interpreted with caution, especially when U-Cd is used to assess Cd burden.19 ,21
The most important limitation is that the study group was relatively small, and all 109 participants were kidney donors and therefore relatively healthy. The few and inconsistent associations between renal biomarkers (KIM-1, Alb and RBP) and cadmium in urine may be due to chance, since many associations were tested. As the kidney cadmium levels were relatively low, it is hard to draw conclusions about higher levels of kidney cadmium. It is possible that people with diabetes, hypertension or other medical conditions are more susceptible even at these relatively low kidney Cd levels. We believe, however, that this group can be seen as a relatively representative sample of the healthy general population.
Conclusions
Our results suggest a causal association between low-level kidney cadmium and urinary excretion of A1M in a group of healthy kidney donors. Urinary A1M may be a sensitive biomarker for effects of low-level cadmium exposure. No associations with kidney cadmium were found for other urinary proteins, although levels of some of these proteins were associated with urinary cadmium. Such associations are likely to be due to renal physiology rather than to renal toxicity.
Acknowledgments
The authors thank Elisabeth Fabricius-Lagging, Johan Molne, Cecilia Modigh and Magnus Akerstrom for help with part of the data collection.
References
Supplementary materials
Supplementary Data
This web only file has been produced by the BMJ Publishing Group from an electronic file supplied by the author(s) and has not been edited for content.
Files in this Data Supplement:
- Data supplement 1 - Online supplement
Footnotes
-
Contributors LB and GS designed the study. TL analysed cadmium in the kidney biopsies, blood and urine. MW cleaned and analysed the data, performed most of the statistical analyses and wrote the first draft of the manuscript. All authors edited the draft, discussed the interpretation and approved the final version of the manuscript.
-
Funding The study was supported by Sahlgrenska University Hospital. Grant number ALFGBG 139121.
-
Competing interests None.
-
Patient consent Obtained.
-
Ethics approval The study was approved by the Ethics Committee at the University of Gothenburg and the work was carried out in accordance with the Code of Ethics of the World Medical Association (Declaration of Helsinki).
-
Provenance and peer review Not commissioned; externally peer reviewed.
Linked Articles
- Correction