Article Text

Abstract
Objectives Inconsistent epidemiological findings, debate over interpretation, and extrapolation of findings from animal studies to humans have produced uncertainty surrounding the carcinogenicity of trichloroethylene (TCE) exposure in occupational settings. We updated meta-analyses of published case–control and cohort studies exploring occupational TCE exposure and kidney cancer risk, incorporating new analytical results from three recently published cohort studies and a case–control study.
Methods PubMed MEDLINE was searched for studies published from 1950 to 2011 assessing occupational exposure to chlorinated solvents, degreasers or TCE. All cohort (N=15) and case–control (N=13) studies included in analyses were stratified by assessment of occupational exposure to TCE specifically and to any chlorinated solvent.
Results Significantly elevated summary estimates were observed for cohort studies (relative risk (RR) 1.26, 95% CI 1.02 to 1.56; p heterogeneity=0.65), case–control studies (OR 1.35, 95% CI 1.17 to 1.57; p heterogeneity=0.41), and cohort and case–control studies combined (RR 1.32, 95% CI 1.17 to 1.50, p heterogeneity=0.63) that specifically assessed TCE exposure after excluding outlier studies that contributed to heterogeneity. Non-significantly elevated summary estimates were generally observed for studies of workers exposed to chlorinated solvents but who were not assessed for TCE specifically.
Conclusions Regardless of study design, significant and stronger estimates were only observed in studies specifically assessing occupational exposure to TCE. Estimates were lower in studies assessing occupational exposure to chlorinated solvents. This updated meta-analysis supports an association between occupational TCE exposure and kidney cancer and provides evidence that exposure misclassification may weaken estimates assessing exposure to the broader class of chlorinated solvents.
Statistics from Altmetric.com
Introduction
Since the 1920s, trichloroethylene (TCE) has been manufactured for commercial use as a solvent.1–3 Used primarily in the vapour degreasing of metal parts,4 TCE has also been used in the dry-cleaning, textile, health services, agriculture, electronic, leather processing, food and chemical industries.1–3 Currently, 80%–90% of TCE manufactured worldwide is used for the industrial degreasing of metals and individuals working in degreasing operations are among the most heavily TCE exposed workers.2 ,5 Because of public health concerns, since the 1970s TCE use in most industries has been phased out and it has replaced by other solvents.6 Therefore, use has declined in most high-resource countries.2 ,4 Currently, TCE continues to be classified as a hazardous waste pollutant, a common groundwater contaminant, and a frequent chemical contaminant found at Superfund sites.1 ,4 ,6
The US Environmental Protection Agency has released the most recent human risk assessment for TCE, increasing its classification to ‘carcinogenic to humans’.7 The International Agency for Research on Cancer currently classifies TCE as a Group 2A ‘probable human carcinogen’ based on limited human evidence of carcinogenicity but sufficient evidence in animal studies.1 TCE exposure has been associated with significantly higher rates of benign and malignant tumours at multiple tissue sites in several species.1 ,6 In humans, epidemiological associations of cancer risk have been strongest for kidney cancer.5 ,8–10 Rapidly absorbed and distributed to various tissues in the body via systemic circulation, TCE is capable of crossing membranes due to its lipophilic nature.4 Relative to blood, high concentrations of TCE are attained in the brain, liver and kidney, all important organs of TCE-associated toxicity in animals and humans.4 ,8 In the kidney, TCE is bioactivated to reactive intermediates through initial glutathione S-transferase (GST) conjugation prior to bioactivation by cysteine conjugate β-lyase (CCBL1) enzymes to form reactive cysteine S-conjugates, the metabolites suspected of being responsible for TCE's nephrotoxic and nephrocarcinogenic effects.11 ,12
In 2006, the National Academy of Sciences recommended that additional meta-analytical studies be conducted to further assess human health risk from TCE exposure.13 Uncertainty still remains surrounding the toxicological and carcinogenic potential of TCE due to inconsistent findings from previously published epidemiological studies, debate over the interpretation of study results, and the extrapolation of animal study findings to humans.1 ,6 In addition, previous TCE meta-analyses have included studies of mixed chlorinated solvents in their analyses of occupational TCE exposure, which could result in dilution of observed risks due to misclassification. Recently, a large case–control study was conducted to specifically evaluate renal cancer risk associated with occupational TCE exposure assessed through analysis of detailed occupational exposure histories. Results from this study supported an association between TCE exposure and increased renal cancer risk, particularly among individuals with genetic variants directly involved in the reductive metabolism and formation of nephrotoxic and carcinogenic TCE metabolites.11 The present analysis incorporates data from this large case–control study as well as recently published studies in a meta-analytical review to improve evaluation of the relationship between occupational TCE exposure and kidney cancer risk. In addition to updating previous meta-analyses, the current study also compares how the relationship between occupational TCE exposure and kidney cancer risk in epidemiological studies has evolved from earlier to more recent studies in which workers were likely to be exposed to lower levels of TCE but that also applied improved study design and exposure assessment methodologies.2 ,6 ,14
Methods
We conducted a meta-analysis of all cohort and case–control studies of occupational exposure to TCE and kidney cancer. A PubMed MEDLINE search was performed for studies published from 1950 through 2011 using the terms ‘trichloroethylene and cancer’, ‘organochlorine exposure and cancer’ and ‘occupational solvent exposure and cancer’. References in all publications were cross-checked to identify studies that may have been missed by our literature search. Studies of TCE exposure from drinking water were excluded, given the difference in the route and exposure levels.15 We restricted analyses to studies that specifically assessed exposure to chlorinated solvents, degreasing agents or TCE. As a result, a number of standardised mortality ratio/standardised incidence ratio (SMR/SIR) studies conducted to evaluate kidney cancer risk among workers who may have been exposed to TCE but for whom the likelihood of exposure was low (compared to other industrial solvents used in paint, shoe construction, dock-yards, benzyl chloride, tanning, nuclear material, construction equipment, diesel engines, and lamp manufacturing) were excluded. Except for one study that specifically assessed TCE exposure,16 studies of dry-cleaning, dry-cleaners or launderers were excluded as TCE use as a dry-cleaning solvent has been rare since the 1960s.2 Only papers written in English that clearly reported results for kidney cancer (including adenocarcinomas and renal pelvis cancer) or renal cancer were included in the analyses. With these a priori exclusion criteria, our search identified 26 cohort and 14 case–control studies.
Exclusions were made for cohort studies reporting proportionate mortality ratios and proportionate cancer mortality ratios, and for those reporting SMRs without providing CIs or exact numbers of expected and observed cases. For two studies, effect measures (ie, SIR and OR) were calculated using the number of subjects provided in the papers (ie, expected/observed cases and unexposed/exposed subjects).16 ,17 Effect measures for these two studies were calculated combining the number of both male and female subjects, given the small number of cases of each group to explain kidney cancer risk differences by sex.16 ,17 When the same study reported associations of kidney cancer and TCE exposure and job title, data providing the most precise exposure assessment for TCE exposure were used. For example, two Canadian case–control studies were identified that used different exposure assessment methodologies and recruited an overlapping set of cases from the same population.18 ,19 The study with expert reviewed subject-specific TCE data which included a larger study population was selected.18 In addition, three US studies utilising the same cohort in Utah have been published,20–22 but only the most recent cohort follow-up study was selected.22 Likewise, two US studies conducted on one Californian cohort study have been published,23 ,24 but only results from the extended follow-up study were utilised for this analysis.24 Also identified were two studies utilising the same cohort with different inclusion criteria.25 ,26 The larger study with the longer follow-up period was analysed.26 Therefore, the final analysis included data from 15 cohort and 13 case–control studies.
All cohort and case–control studies were evaluated by an expert industrial hygienist (PS), blinded to study results. Studies were subsequently categorised into two groups, TCE-exposure and chlorinated solvent-exposure studies. TCE-exposure cohort studies (N=10) were primarily industry-based studies in which TCE exposure had been identified through bio-monitoring data or job exposure matrices (JEMs). For two of these studies, the subcohort analysis was selected given that TCE exposure was assessed utilising more restrictive inclusion criteria, thus reducing the likelihood of exposure misclassification.24 ,27 However, similar results with less precise estimates and slightly broader CIs were observed when analyses were not restricted to the subcohort members. Case–control studies that assessed TCE exposure or evaluated metal degreasing/cleaning industry workers were classified as TCE-exposure studies (N=10). Studies of chlorinated solvent-exposed workers were more limited in that they did not specifically evaluate TCE exposure. Cohort studies of chlorinated solvents (N=5) included workers exposed to any type of chlorinated solvent, and metal and aircraft manufacturing workers, only some of whom may have used or been exposed to TCE. Case–control studies of chlorinated solvent-exposed workers included participants specifically assessed for chlorinated solvent exposures and those in the iron and metal ware industry (N=3).
Because of improvements in exposure assessment methods and recent reductions in occupational exposure levels,2 ,6 ,14 we compared results for cohort studies published from 1988 through 1999 to those published after 1999. Similarly, case–control studies published from 1988 to 1995 were compared to those published on or after 1995. Each time period reflects the median publication year for each type of study. Results were also compared for cohort studies by the median year of follow-up initiation and for case–control studies by the median recruitment year. Since results were virtually identical, we only present findings stratified by median publication year. Cohort study results were also compared by the median of the studies’ maximum length of follow-up.
Meta-analyses were initially conducted for cohort and case–control studies separately and data were subsequently combined. Summary estimates for studies of TCE-exposed and chlorinated solvent-exposed workers were calculated independently, and subsequently combined. Subgroup summary estimates were calculated by the type of kidney cancer (ie, renal cell carcinoma (RCC)), study location (ie, USA or Europe), study type (ie, SMR, SIR, population- and/or hospital-based studies), exposure ‘level’ (ie, high vs low duration and intensity), and for specific industries reported to have high TCE-exposure levels, such as the aircraft manufacturing/maintenance industry.3 Data from each study were merged using a random effects model to estimate summary relative risks (RRs) or ORs and 95% CIs. Higgin's I2 statistic and Cochrane's Q test were used to statistically evaluate sources of heterogeneity across studies.28 ,29 Results from each study were omitted one at a time to reduce and identify the source of heterogeneity. Summary estimates without evidence of heterogeneity are presented as main findings. Publication bias was assessed statistically using Egger's and Begg's methods as well as by evaluating funnel plots.29 The influence of potential publication bias on risk estimates was further evaluated by implementing the Duval and Tweedie non-parametric ‘trim-and-fill’ method.30 All analyses were conducted using STATA software V.10. Statistical tests were determined to be significant at a two-sided p value of <0.05.
Results
All cohort16 ,22 ,24 ,26 ,27 ,31–40 and case–control11 ,17 ,18 ,41–50 studies included in this analysis are summarised in supplementary table S1. For each study, data regarding study size, location, exposure assessment methods, risk estimates, and person-years and length of follow-up (for cohort studies) are provided.
Cohort studies
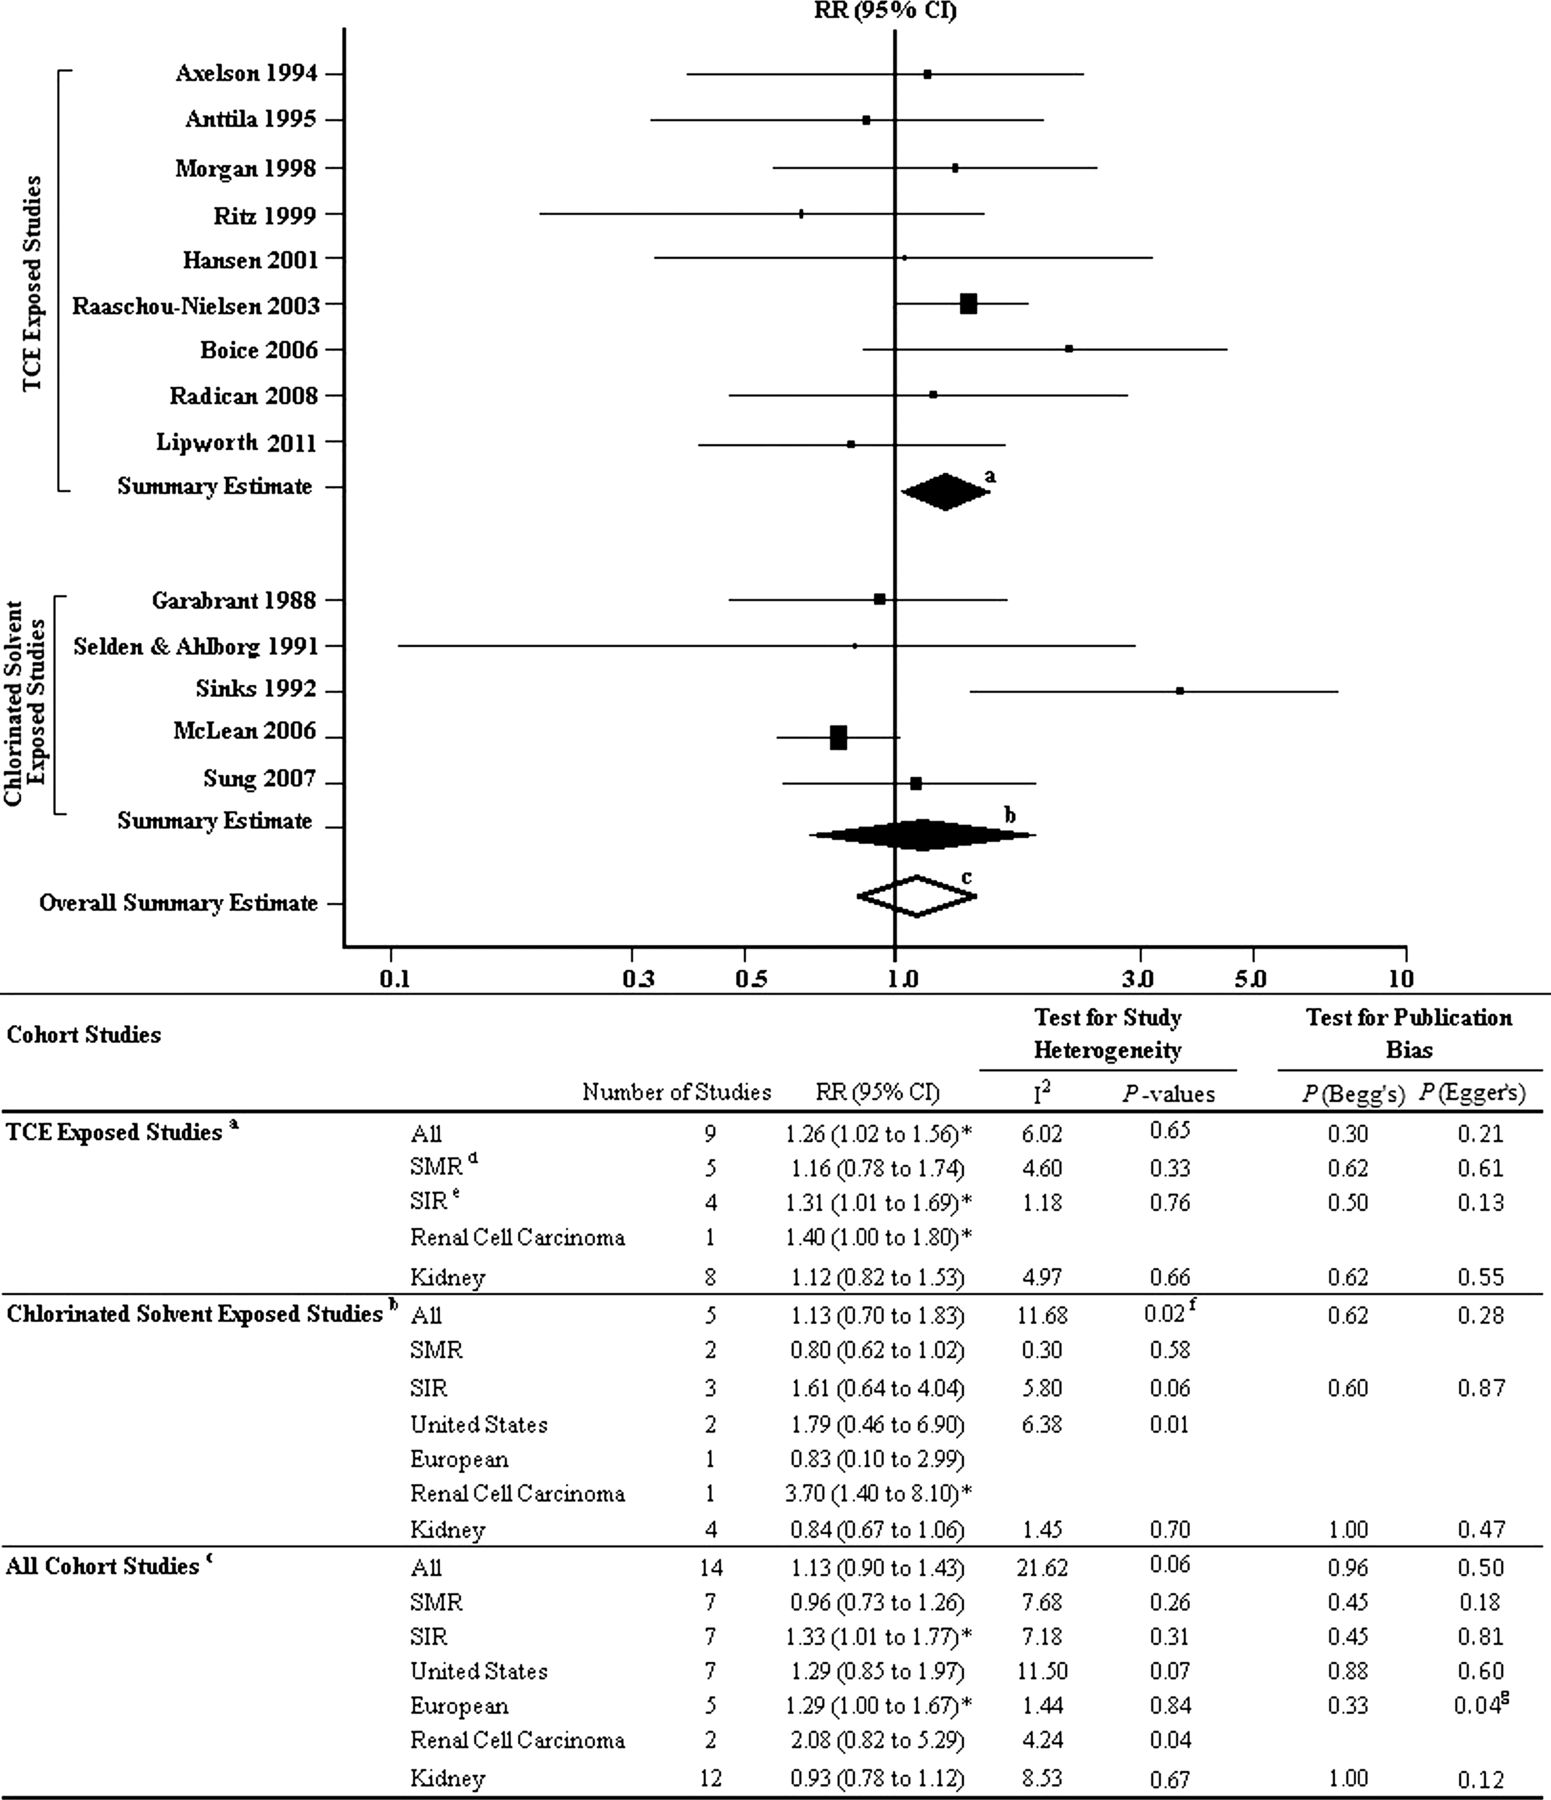
An elevated summary estimate was observed for cohort studies of TCE-exposed workers (RR 1.41, 95% CI 0.98 to 2.05; p heterogeneity=0.01). After exclusion of the Henschler et al study,34 identified as the source of heterogeneity, a similar estimate of 1.26 (95% CI 1.02 to 1.56; p heterogeneity=0.65) was observed (figure 1). Risk was not elevated among cohort studies of chlorinated solvent-exposed workers before (RR 1.13, 95% CI 0.70 to 1.83; p heterogeneity=0.02) or after exclusion of one outlier study (RR 0.84, 95% CI 0.67 to 1.06; p heterogeneity=0.70).39 For all cohort studies combined, a non-significantly elevated summary risk estimate of 1.29 was observed, although this risk decreased after removal of the Henschler et al study from analysis (RR 1.13, 95% CI 0.90 to 1.43; p heterogeneity=0.06).34

Summary of occupational TCE-exposure and kidney cancer cohort studies. Summary estimates calculated for: aTCE-exposure cohort studies excluding the outlier Henschler et al34 study; bchlorinated solvent-exposure cohort studies; call cohort studies combined excluding the outlier Henschler et al34 study. dTCE-exposure SMR studies were all conducted in the USA. eTCE-exposure SIR studies were all conducted in Europe. fExclusion of Sinks et al39 eliminated heterogeneity: RR 0.84, 95% CI 0.67 to 1.06. gNo additional studies were added after applying the ‘trim-and-fill’ method and the summary estimate remained unchanged. *p<0.05. RR, relative risk; SIR, standardised incidence ratio; SMR, standardised mortality ratio; TCE, trichloroethylene.
When studies of cancer incidence (SIR) and mortality (SMR) were compared, stronger risk estimates were observed among SIR studies. We found significantly elevated summary estimates for TCE-exposure SIR studies (RR 1.31, 95% CI 1.01 to 1.69; p heterogeneity=0.76) and among all SIR studies combined (RR 1.33, 95% CI 1.01 to 1.77; p heterogeneity=0.31) after excluding the outlier study that notably reported the highest risk estimate.34 Risk among mortality studies was not elevated.
Among cohort studies that examined duration of occupational TCE exposure (N=3), a significant summary risk estimate of 1.52 (95% CI 1.08 to 2.13; p heterogeneity=0.60) was observed among workers with the longest duration of exposure (5+ years24 ,27 and 10+ years31) but not among workers with a shorter exposure duration (<1 year24 ,27 and <10 years31) (RR 0.90, 95% CI 0.56 to 1.45; p heterogeneity=0.60). For TCE-exposure aircraft production/maintenance worker cohorts (N=4), a non-significantly elevated summary risk was seen (RR 1.29, 95% CI 0.86 to 1.93; p heterogeneity=0.50).22 ,24 ,25 ,36 No association was observed for studies that used biomonitoring to assess TCE exposure (RR 1.03, 95% CI 0.59 to 1.78; p heterogeneity=0.90).16 ,31 ,32
Overall, no evidence of publication bias, assessed using funnel plots or Begg's and Egger's tests, was identified for cohort study analyses except for European cohorts (p Egger's=0.04). The summary estimate remained unchanged when the ‘trim-and-fill’ method was applied, indicating the presence of bias was insufficient to warrant trimming.
Case–control studies
A summary risk estimate of 1.55 (95% CI 1.18 to 2.05; p heterogeneity=0.02) was seen for case–control studies of TCE-exposed workers. After removal of the Vamvakas et al study, which reported the highest risk estimate and introduced the greatest variability across studies,50 risk remained elevated (OR 1.35, 95% CI 1.17 to 1.57) without evidence of heterogeneity (p=0.41) (figure 2). A similar but non-significant summary estimate of 1.50 was shown among chlorinated solvent-exposed workers. This estimate increased to 2.16 (95% CI 1.31 to 3.56; p heterogeneity=0.56) after exclusion of one outlier study.48 For all case–control studies combined, a significantly elevated association was observed for TCE exposure and renal cancer risk before (OR 1.55, 95% CI 1.21 to 1.99; p heterogeneity=0.01) and after (OR 1.43, 95% CI 1.18 to 1.72; p heterogeneity=0.19) removal of the outlier Vamvakas et al study.50
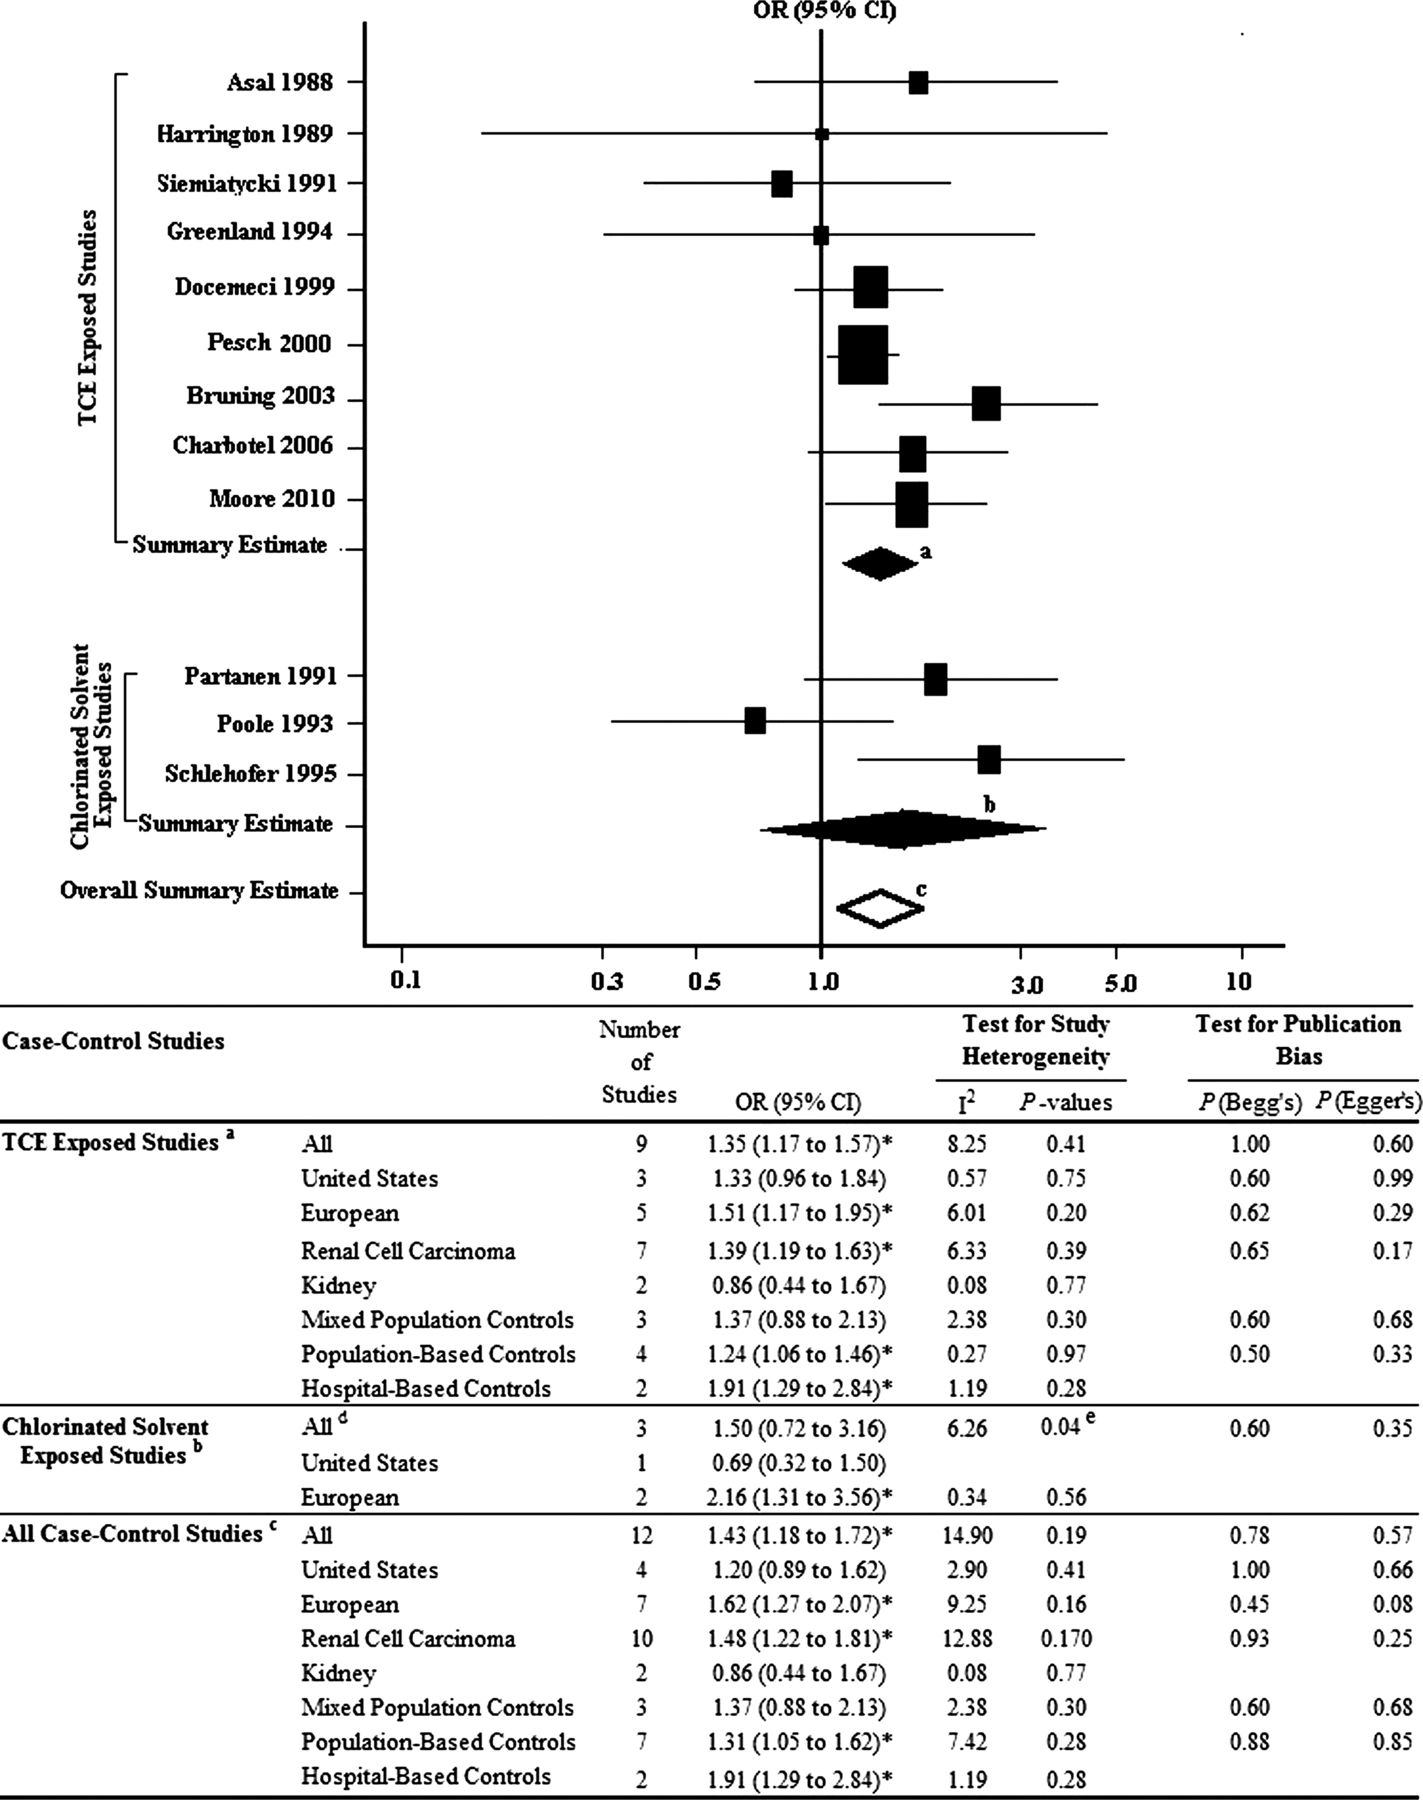
Summary of occupational TCE-exposure and kidney cancer risk in case–control studies. Summary estimates calculated for: aTCE-exposure case–control studies excluding the outlier Vamvakas et al50 study; bchlorinated solvent-exposure case–control studies; call case–control studies combined excluding the outlier Vamvakas et al50 study. dChlorinated solvent-exposure studies were population-based studies of renal cell carcinoma. eExclusion of Poole et al48 removed heterogeneity: OR 2.16, 95% CI 1.31 to 3.56*. *p<0.05. TCE, trichloroethylene.
When case–control studies were compared by location, stronger summary estimates were observed for European studies. European study estimates were significantly elevated regardless of TCE specificity categorisation and remained so after exclusion of the Vamvakas et al study that was identified as the source of heterogeneity.50 Similarly, results of hospital-based and population-based studies, in spite of TCE specificity categorisation, were significantly elevated after exclusion of the Vamvakas et al study.50 Stronger risk estimates, regardless of TCE exposure classification, were also observed for studies examining RCC risk but not for those that assessed the broader category of kidney cancer.
Among case–control studies that estimated TCE intensity (N=6), a summary estimate of 1.96 (95% CI 1.24 to 3.08; p heterogeneity=0.13) was observed for the highest exposure intensity studies, those with exposure levels at or above the median level of intensity.11 ,17 ,18 ,42 ,43 ,50 A summary estimate of 1.55 (95% CI 1.05 to 2.28; p heterogeneity=0.16) was observed for low intensity exposure studies.11 ,17 ,42 ,43 ,50 Exclusion of the Vamvakas et al study from analysis of low (OR 1.49, 95% CI 1.02 to 2.17; p heterogeneity=0.16) and high (OR 1.68, 95% CI 1.23 to 2.30; p heterogeneity=0.39) TCE exposure intensity revealed similar estimates.50
No evidence of publication bias, statistically assessed using Begg's or Egger's tests as well as evaluated graphically by funnel plots, was observed for case–control studies.
Cohort and case–control studies combined
A summary estimate of 1.41 (95% CI 1.16 to 1.70; p heterogeneity <0.001) was observed for all cohort and case–control studies combined; this estimate remained significantly elevated (RR 1.34, 95% CI 1.17 to 1.53; p heterogeneity=0.24) after exclusion of three outlier studies.34 ,35 ,50 A similar summary estimate was found for TCE-exposure cohort and case–control studies combined (RR 1.48, 95% CI 1.19 to 1.83; p heterogeneity=0.002) and risk remained significantly elevated after elimination of the Henschler et al and Vamvakas et al outlier studies (RR 1.32, 95% CI 1.17 to 1.50; p heterogeneity=0.63).34 ,50 Among studies of chlorinated solvent-exposed workers, risk was not significantly elevated before (RR 1.27, 95% CI 0.84 to 1.91; p heterogeneity=0.002) or after (RR 0.94, 95% CI 0.72 to 1.23; p heterogeneity=0.26) removal of outlier studies.39 ,49 No evidence of publication bias was detected using statistical tests of assessment or funnel plots (data not shown).
Temporal associations between occupational TCE exposure and kidney cancer risk were assessed to evaluate potential differences in risk estimates reported due to improvements in epidemiological methods and reduction in exposure levels over time. Summary estimates were evaluated for cohort and case–control studies stratified by their median publication years, 1999 and 1995, respectively. For cohort studies, no statistically significant difference was observed between the two time periods. However, risk estimates for incidence-based (N=3; RR 1.31, 95% CI 1.02 to 1.69; p heterogeneity=0.71) and European (N=2; RR 1.38, 95% CI 1.04 to 1.83; p heterogeneity=0.68) cohort studies published prior to and including 1999 were elevated (figure 3). No indication of publication bias was suggested for temporal analysis of cohort studies.

Meta-analytical results stratified by the median publication year for cohort studies, 1999. Summary estimates calculated for: acohort studies published before 1999 excluding the outlier Henschler et al34 study; bcohort studies published in and after 1999. cExclusion of Sinks et al39 removed heterogeneity: RR 1.07, 95% CI 0.66 to 1.72. *p≤0.05. RR, relative risk; SIR, standardised incidence ratio; SMR, standardised mortality ratio.
For case–control studies, a summary estimate of 1.83 (95% CI 1.32 to 2.53; p heterogeneity=0.003) was observed for studies published from 1995 onwards. After exclusion of the Henschler et al study,50 heterogeneity was no longer observed (p=0.13) and the summary estimate remained elevated (OR 1.54, 95% CI 1.23 to 1.94), although there was evidence of publication bias (p Begg's=0.04; p Egger's=0.01) (figure 4). After application of the ‘trim-and-fill’ method, three studies were added and the summary estimate remained significantly elevated (OR 1.32, 95% CI 1.04 to 1.68). For European (OR 1.66, 95% CI 1.24 to 2.23; p heterogeneity=0.08; p Egger's=0.01) and hospital-based (OR 1.91, 95% CI 1.29 to 2.84; p heterogeneity=0.28) studies published from 1995 onwards, summary estimates remained significantly elevated after removal of the Henschler et al study.50 Results also remained significantly elevated for European studies after application of the ‘trim-and-fill’ method which added three studies (OR 1.32, 95% CI 1.00 to 1.76). Among case–control studies published before 1995, summary estimates were not elevated. Analysis of cohort studies by the median of the maximum duration of follow-up (in years) revealed no differences (data not shown).

Meta-analytical results stratified by the median publication year for case–control studies, 1995. Summary estimates calculated for: acase–control studies published before 1995; bcase–control studies published in or after 1995 excluding the outlier Vamvakas et al50 study. cAll case–control studies published in or after 1995 are renal cell carcinoma studies. Application of the ‘trim-and-fill’ method added three studies: dOR 1.32, 95% CI 1.04 to 1.68*; eOR 1.32, 95% CI 1.00 to 1.76*. *p<0.05.
Discussion
This updated meta-analysis, evaluating kidney cancer risk and occupational TCE exposure, incorporated three recently published cohort analyses24 ,35 ,40 and one case–control study.48 Elevated estimates were observed for cohort studies overall and for those that specifically assessed TCE-exposed workers. No association was observed for cohort studies of chlorinated solvent-exposed workers. Risk estimates were also significantly increased for all case–control studies combined, as well as for all studies of TCE-exposed workers. After removal of studies that contributed to heterogeneity, and which also demonstrated the highest risks,34 ,50 estimates for both cohort and case–control studies of TCE-exposed workers remained significantly elevated. Regardless of study design, stronger estimates were observed for studies of TCE-exposed workers compared to those evaluating chlorinated solvent-exposed workers. These latter studies may have been more prone to exposure misclassification since broader groups of chlorinated solvents were evaluated in these workers. These findings suggest that exposure misclassification may have contributed to reductions in risk estimates reported when TCE was not specifically assessed.
Given improvements in epidemiological study methods and the reduction in TCE exposure levels over time,2 ,6 ,14 we compared cohort and case–control studies published before and after the midpoint year of publication. Stronger summary estimates were observed for recently published case–control studies compared to those published prior to 1995, suggesting possible improvements in the validity and reliability of exposure assessment techniques used in occupational epidemiology. Interviewing techniques that include enquiries about specific tasks conducted during employment and the frequency of exposure to specific solvents could reduce exposure misclassification.51 ,52 Although no significant association over time was observed for cohort studies, improvements in exposure assessment for these studies have been less dramatic than for those applied in case–control studies.
The elevated cohort and case–control summary risk estimates observed in this meta-analytical review are consistent with those reported previously by Scott and Jinot,53 Wartenberg et al15 and Kelsh et al.3 However, our study is unique in that the expert was blinded to study results while classifying TCE exposure specificity. The review by Scott and Jinot also evaluated risk among subjects with the greatest potential for TCE exposure, where a similar yet slightly stronger summary estimate for kidney cancer was observed.53 With the exception of one laundry/dry-cleaning study that evaluated TCE specifically, we excluded most/dry-cleaning studies that were included in the Wartenberg review15 based on the rationale that TCE use as a dry-cleaning fluid had been reduced substantially since the 1960s and workers in this industry are frequently exposed to other solvents.2 Our review incorporated results from an updated cohort study with 12 additional years of follow-up24 as well as two recently published large-scale cohort studies not previously evaluated.35 ,40 Two of these cohorts were categorised as chlorinated solvent-exposure studies and did not observe an increase in kidney cancer risk.35 ,40 Because studies of chlorinated solvent-exposed workers provided risk estimates for exposure to any type of chlorinated solvent, as opposed to TCE specifically, risks, if truly related to TCE, would most likely be diluted, as would be expected from non-differential exposure misclassification.11 In addition, we also updated previously published meta-analyses by incorporating data on 102 cases and 431 controls from a European case–control study specifically designed to assess occupational TCE exposure through detailed expert review of job histories, exposure-specific questionnaire modules and expert review of exposure records when available.48
In agreement with previously published meta-analyses of occupational TCE exposure and kidney cancer,3 ,15 ,53 our analysis observed stronger summary estimates for case–control than cohort, cancer incidence compared to mortality, and European compared to US studies. Cohort studies, compared to other study designs, are less likely to be influenced by recall bias and resulting exposure estimates are considered to have greater validity since investigators often obtain site-specific exposure information reflecting current exposures. Because self-reported TCE exposure data were utilised in several case–control studies, the higher risk estimates observed for these studies may have been subject to recall bias. Yet, case–control studies are still considered the design of choice for rare diseases, as more cases can be evaluated. Moreover, the latency of renal cancer can exceed 20 years, and therefore current exposure levels may not accurately represent those relevant to the latency of this disease. Occupational cohort studies comparing cancer risk in workers to risk in the general population may bias results towards the null since morbidity and mortality rates within workforces are likely to be lower than those of the general population due to the healthy worker effect.54 For studies relying solely on death certificates, a large proportion of incident cases could be missed since survival is high and renal cancer may not accurately be reflected as a cause of death.55 Incidence studies are less likely to be biased by outcome misclassification and thus are more likely to accurately reflect exposure-related risk. The use of incidence data in European cohorts and mortality data in all but one US cohort in our review may also explain the higher summary estimates observed for European studies. Of the 28 studies examined in our review, the cohort and case–control studies with the highest exposure-related risk estimates were conducted in Germany.34 ,50 Both studies introduced substantial heterogeneity into our analyses due to their considerably higher risk estimates compared to other studies. However, the reason for this heterogeneity is not clear. Nonetheless, exclusion of these studies from analyses due to potential issues related to selection bias of controls or incomplete cohort identification,53 substantially reduced heterogeneity but did not have a material impact on the summary estimates observed.
Kidney toxicity following exposure to TCE is postulated to be a prerequisite for the development of renal cancer in humans.12 Although TCE exposure has been shown to be related to nephrotoxicity in animal studies, human nephrotoxicity has only been observed at high exposure levels (>35 ppm).56–59 Interestingly, a recent study using a novel sensitive marker of renal toxicity (ie, kidney injury molecule -1) demonstrated nephrotoxic effects of TCE at much lower exposure levels (<12 ppm).60 TCE reactive intermediates formed by renal GST and CCBL1 enzymes may be responsible for TCE's nephrotoxic and possibly nephrocarcinogenic effects.11 ,12 Two renal cancer case–control studies11 ,61 examined the role of genetic polymorphisms in GST-theta and TCE risk. In one study, RCC risk was limited to exposed subjects with an active GSTT1 genotype that was further modified by certain CCBL1 gene variants.11 The second study, a reassessment of RCC risk and TCE exposure from an earlier case–control study,12 observed no modification by GSTT1 genotype on TCE exposure and RCC risk.61 This study, however, did not adjust for confounders and included additional controls from an assortment of sources. These findings raise the possibility that risk may be restricted to genetically susceptible subpopulations and support the need for future evaluation of common genetic variation in relation to TCE exposure and RCC risk modification.
In our meta-analysis, we classified studies by specificity to TCE exposure, assuming that greater specificity minimised potential exposure misclassification. Although consistently elevated estimates were observed across various subgroups, limitations due to exposure misclassification are recognised. Studies using job titles or JEMs potentially had limited exposure information with which to evaluate specific chemical exposures. Studies relying solely on job titles (including JEM-based studies) to estimate exposure are limited in that exposure may vary considerably among individuals with the same title. Additionally, most of the studies in our review lacked subject-specific exposure measurements with the exception of three European biomonitoring studies.16 ,31 ,32 Biomarkers may not capture chronic long-term exposures that are relevant in studies of cancer, particularly if exposures changed over time or measurements were ascertained at a single or few moments in time. Exposure to other solvents among workers may also alter urinary biomonitoring measurements. Besides other organic solvents, exposure to other agents could potentially confound or modify results. Other limitations include the possibility of selection bias, particularly among studies where controls were not matched to cases, and the possibility of outcome misclassification for those lacking histological confirmation of cancer subtype. Lastly, publication bias in meta-analyses can potentially skew positive results away from the null, although publication bias was not a concern in this study.
While it has been suggested that previous meta-analyses of epidemiological studies have been limited due to exposure misclassification and unmeasured confounding, these factors would most likely bias results towards the null.62 For unmeasured confounding to truly impact on results, associations with both the disease risk factor and correlation with the exposure of interest must be very strong.62 Such relationships are extremely unlikely in most occupational epidemiological studies, although we do acknowledge that results may be biased away from the null by chance.
In summary, our review differentiated studies that assessed TCE exposure specifically, from those that evaluated exposures to broader groups of chlorinated solvents, demonstrating how reduced exposure misclassification strengthened the association between exposure and risk. This updated meta-analysis, which incorporated analytical results from four additional studies and employed stringent exposure inclusion criteria, supports an association between occupational TCE exposure and kidney cancer risk.
What this paper adds
-
This article presents the results of an updated meta-analysis that may be useful for future reviews of human health risk from occupational TCE exposure and kidney cancer risk by both national and international regulatory agencies.
-
These meta-analytical findings incorporated three recently published cohort studies and a case–control study and support an association between occupational TCE exposure and increased kidney cancer risk in human populations.
-
The association with kidney cancer was not observed for studies that assessed exposure to the broad classifications of chlorinated solvents, suggesting that exposure misclassification may have biased previous risk estimates towards the null.
-
These findings show that efforts to reduce exposure misclassification by comparing studies that assessed TCE specifically to those assessing any type of chlorinated solvent appear to strengthen the association between TCE exposure and kidney cancer risk.
References
Supplementary materials
Supplementary Data
This web only file has been produced by the BMJ Publishing Group from an electronic file supplied by the author(s) and has not been edited for content.
Files in this Data Supplement:
- Data supplement 1 - Online table 1
Footnotes
-
Funding This study was supported by the Intramural Research Program of the National Institutes of Health and the National Cancer Institute.
-
Contributors SK had full access to all the data in the study and takes responsibility for the integrity of the data and the accuracy of the data analysis; SK, QL, PAS and LEM contributed to study concept and design; SK and LEM contributed to the analysis and interpretation of data and drafted the manuscript; SK, QL, PAS, NR, K-ML, RV and LEM contributed to acquisition of data, critically revised the manuscript for important intellectual content and gave final approval of the manuscript for publication.
-
Competing interests None.
-
Provenance and peer review Not commissioned; externally peer reviewed.